⚠️ Warning: this is an old article and may include information that’s out of date. ⚠️
The problem
On the desktop we’re quite privileged to have nice debugging tools such as Firebug and Web Inspector in Webkit-based browsers. But when it comes to mobile, debugging JavaScript with console.log.
isn’t quite as easy.
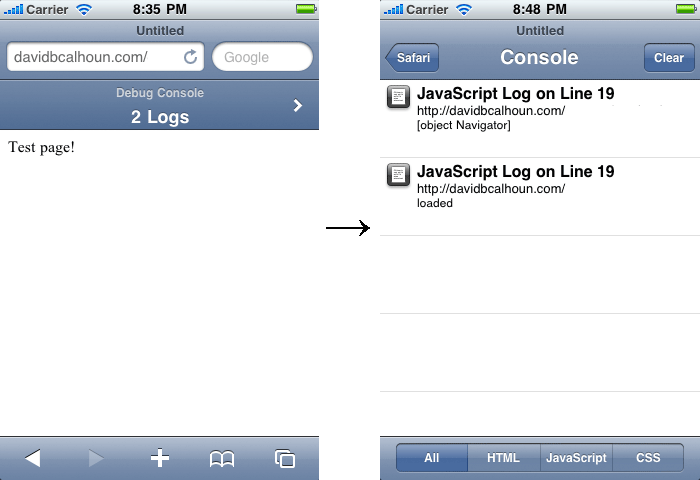
Probably the best available tool on mobile at the moment is mobile Safari’s console, which looks like the following when enabled (Settings -> Safari -> Developer -> Debug Console):

Mobile Safari's debug console
On the left you can see the debug console displayed above the document itself, and on the right is an example of what you might see after outputting an object or a string of text to
|
1
|
. It’s the best debugging tool on mobile, but it’s not without its issues.
The first issue is that the debug console is taking up space in the screen and interfering with how an actual user would view the website. I could image this could become particularly annoying when trying to develop a web app in the style of the new YouTube mobile, which doesn’t function like a traditional webpage at all, and relies on the screen being a certain height in order to display its content.
The second issue is that you can’t see the contents of JavaScript Objects. We’re a bit spoiled being able to see a tree view of objects on the latest browsers with the latest debugging tools, and therefore it makes the experience on mobile Safari less than adequate. When we type console.log(navigator) all we can see on mobile Safari is [object Navigator], which leaves something to be desired.
So what about Android? Google offers something called Android Debug Bridge, which is a client-server debugging solution that can be used either for web or application development. As such, when you view the messages the devices sends to the server, the vast majority of messages will be messages about low-level operations, stuff we usually don’t care much about when developing with JavaScript. The workaround for this is to grep for “console” on the command line, which will only display the messages we’re interested in.
The solution: server side console.log!
Why not just send the contents of your console message to a server, and have it log it? The concept is pretty simple:
- Create a log function that sends an XHR to a server.
- Have the server process the request and log the message to a file.
- Tail the end of the file on the command line to see the latest messages.
The implementation is pretty simple. In JavaScript we have this code:
|
|
In summary, the above code adds a new method to the console object called toFile, which simply takes the inputted data and sends it to the specified URL. The only bit of trickery here is the function sanitize, which detects if the message being passed in is an object. If it is, it copies it to a new object containing only strings (which gets around JSON “circular reference” errors) and runs JSON.stringify() on it, which lets us peek into its contents one level deep.
The server side PHP code to make this work is even simpler:
|
|
On the server, we log in with terminal, navigate to the directory containing the file console.log, and simply tail the end of the file, which shows live updates as new messages are added to the end of the file:
tail -f console.log
Example
Once we have the above code in place, using the console is very simple:
|
|
After running this code, you should see this pop up on your terminal:
1284574866900 hello world!
1284575008914 {
  "geolocation": "[object Geolocation]",
  "standalone": "false",
  "cookieEnabled": "true",
  "language": "en-us",
  "productSub": "20030107",
  "product": "Gecko",
  "appCodeName": "Mozilla",
  "mimeTypes": "[object MimeTypeArray]",
  "vendorSub": "",
  "vendor": "Apple Computer, Inc.",
  "platform": "iPhone",
  "appName": "Netscape",
  "appVersion": "5.0 (iPhone; U; CPU iPhone OS 4_1 like Mac OS X; en-us) AppleWebKit/532.9 (KHTML, like Gecko) Version/4.0.5 Mobile/8B117 Safari/6531.22.7",
  "userAgent": "Mozilla/5.0 (iPhone; U; CPU iPhone OS 4_1 like Mac OS X; en-us) AppleWebKit/532.9 (KHTML, like Gecko) Version/4.0.5 Mobile/8B117 Safari/6531.22.7",
  "plugins": "[object PluginArray]",
  "onLine": "true",
  "javaEnabled": "function javaEnabled() {
    [native code]
}",
  "getStorageUpdates": "function getStorageUpdates() {
    [native code]
}",
  "registerProtocolHandler": "function registerProtocolHandler() {
    [native code]
}",
  "registerContentHandler": "function registerContentHandler() {
    [native code]
}"
}
Sweet! Now we can easily see console messages from actual devices. You can potentially use this code to log Events as they occur (on click or touch interactions) and view the actual x/y coordinate values as they’re being detected on the device!
Related
Alex Kessinger implemented a similar concept with node.js running locally
Update
It turns out that Joe Hewitt did this before me with his “Firebug for iPhone”. I have no idea why it took me so long to find this!
Comments